Quantcast
Channel: MSDN Blogs
Viewing all 5308 articles
Browse latest View live

Closing the gap between TFS and Scrum

$
0
0

This post is provided by Senior App Dev Manager, Alexei Govorine who covers the use of scrum with TFS and spotlights TFS Version Control, Dashboards, and Markdown.


Introduction

Scrum is one of the most used agile frameworks that helps people address complex problems while delivering products of the highest possible value. For additional information on what Scrum is all about, see the Scrum Guide.

Team Foundation Server (TFS) or its online version, Visual Studio Team Services (VSTS), are ALM tools created by Microsoft. TFS provides source code management, reporting, requirements management, project management, build automation, release management, and many other features that help teams create high quality software.

Problem Statement

Out of box TFS provides support of Scrum by leveraging a Scrum process template. The template was designed according to guidance from the Scrum Guide and there are numerous resources describing how to use Scrum with TFS, like Sprint Planning, “Sprinting”, and getting visibility into development activities by using TFS Work-items, backlogs, and boards. Unfortunately, there is no clear guidance on how to capture things like: Team Agreements, Definition of Done, Sprint Goals, Sprint Retrospective resultscommitments.

This article is going to provide a guidance on how to close this gap by leveraging TFS Version Control, Dashboards, and Markdown.

Solution

Using Markdown concepts is a great way to extend TFS functionality to bring additional transparency into how the team operates. With every new TFS project a README.md file is created, the purpose of the file is to provide readers with key information about the project, it’s purpose, and objectives. Teams can it use to capture the basic information like: scrum rules (link to scrum guide), link to description of TFS scrum process template, team agreement, and other relevant information.

Capturing Team Agreement:

The team can start by editing the README.md file from the Welcome tab of the project or in VSTS from the landing page of a project.

1. Click on Edit option.

team1

Figure 1, Edit README.MD file

2. While in the edit mode, the team can capture information about team development process (Scrum), links to tutorials, Team Agreement, and other information that the team finds relevant.

team2

Figure 2, Filling README.MD file with scrum information

For the syntax on how to use markdown, see Visual Studio documentation. In the example above we used:

  • [link name](link) – to specify location of the scrum guide and TFS scrum template tutorial.
  • # – specify the heading, number of # (up to six), specifies type of Heading, like ## is Heading2.
  • ** – is for formatting in bold
  • * – is for formatting in italic

3. Once editing is completed and the file is Saved, the team will be able to access Welcome tab to see contents of the README.md file:

team3

Figure 3, Saving and displaying modified README.MD file

Capturing Definition of Done (DOD)

For capturing and displaying DOD, the team can add a markdown widget to a dashboard.

1. The customization will start from going into an Edit mode of the selected dashboard and selecting “Add Widget

team4

Figure 4, Adding Markdown widget to dashboard

2. In the search box type “Markdown”, select Markdown widget and click on Add.

team5

Figure 5, Display newly added Markdown widget on a dashboard

3. From the dashboard, select Configure option of the markdown widget and customize size and contents.

team55

Figure 6, Configuring DOD date on Markdown widget

4. click on Save to complete editing and display results on the dashboard.

team6

Figure 7, Saving and Displaying DOD on dashboard

Capturing Sprint Goals from the Sprint Planning and Sprint Retrospective commitments

Team can continue adding widgets or extending the README.md file and it may work for a first couple of sprints, but fast forward into a Sprint 20+, we can see aggregated data creates clutter.

One way to resolve it is by creating additional dedicated .md files.

There are two options. Option one: create a single file dedicated to capturing all sprint artifacts and data in one place, however still in Sprint 20+ the team will have to deal with over 20 files.

The second option, is to start with a single file dedicated to Sprint Planning and another to Sprint Retrospectives. This way the team will have deal only with two files.

The team be leveraging TFS version control for it.

After creating a new folder called “Process” to isolate process files form product source code, the team should create two files: SprintPlanning.md and SprintRetrospectives.md by

1. From the Code tab portion of the website, right click on newly created Process folder and select Add File(s)

team8

Figure 8, Adding new file to version control

2. In New file name field enter “SprintPlanning.md” and click OK.

team9

Figure 9, Creating SprintPlanning.md file

3. Fill in details of the file and click on Save button to complete editing.

team10

Figure 10, Editing and Saving SprintPlanning.md file

4. One of the TFS features is that any file with extension .md can be pinned to a dashboard. It can be done by right clicking SprintPlanning.md file, click on +Add to Dashboard, select a destination dashboard.

team11

Figure 11, Pinning SprintPlanning.md file to a dashboard

5. Repeat steps 1 to 4 for the SprintRetrospective.md file and return to the dashboard.

NOTE: From usability point of view, it will be better to add latest new information to the top of the file, this way the most recent info will displayed on top, will reduce the amount of scrolling the team has do in Sprint 20+ to get to current data.

team12

Figure 12, Display files on a dashboard

6. Once files are pinned to the dashboard, the size and location of the widget can be adjusted by using Configure feature of TFS dashboards

team13

Figure 13, Customizing position and size of widgets on a dashboard

Finally, the team has a concise view into DOD, Sprint Goals, Sprint Retrospectives, Team Agreement, and any other information the team wants to publish.

team14

Figure 14, Display all the data on a dashboard

Conclusion

Markdown widgets and files is one way to close the gap of capturing information. For additional information on markdown refer to syntax guidance.

Scrum is simple to understand and hard to master. TFS is extremely flexible and can be a complex tool. Hopefully this article helps development teams to simplify the usage of scrum with TFS and help to bring transparency and awareness with minimum waste. Keep calm and scrum on!


Premier Support for Developers provides strategic technology guidance, critical support coverage, and a range of essential services to help teams optimize development lifecycles and improve software quality.  Contact your Application Development Manager (ADM) or email us to learn more about what we can do for you.


The costs of manual and automated tests – 2nd Meetup Stone Tech Saturday

$
0
0

Hello everyone!

After a long time, here I am. Yesterday I talked to lots of incredible people about DevOps, Software Quality and Test Automation. These three subjects are directly associated and we spent some time discussing it there.

Nesta hora, calculávamos os custos num raciocínio no Excel

That time, we were calculating the costs of the manual testing in a software development

It was a Meetup organized by Canal .NET community in a partnership with Stone Pagamentos. Thank you both for the opportunity! One more successful event organized by the community. Stone Pagamento’s office is an amazing place, I was thrilled when I got there!

BTW, they’re hiring good developers. I guess you should give it a try 🙂

As I already said, we talked about testing in a DevOps context. Testing in software development context. When we stop, breathe and calculate the costs of Manual Testing vs Automated Testing, we see that we ALWAYS SHOULD consider automating it! Always!

Well, here is the presentation I used to contextualize the subject. As you can see, we already talked about in on DevOps Summit Brasil and this subject is always polemic and raises a series of thinking. That’s why is always good to talk about it!

And below you can download that spreadsheet we built to make some calculations:

Manual vs Automated Tests costs spreadsheet

I really hope our talk gave you some good message and information to make your days and work better. I learned a lot with you guys!

Improve yourselves. Make your time more useful. Deliver more value in your projects. Automate.

See you next time!

Ricardo Serradas


Microsoft Australia Partner Awards (MAPA) 2017 – not just the product, but everything about the solution!

$
0
0

When it comes to talking about the Microsoft Australia Awards Program, I’m always a little passionate.  As the owner of the program I get the opportunity to ensure every aspect of it is focused on our customers and partners and that fuels my passion.

I am absolutely thrilled to announce some changes we are making to our Microsoft Australia Awards Program.  Based on feedback from our customers as well as you, our partners, we are launching a brand-new set of awards – moving away from products and towards the transformative work and customer outcomes our best partners are driving.

So, what’s new? First, we’ve cut the number of awards down from 30 to 5.  Not only will this allow us to really highlight the winners in a significant way, but it offers partners to demonstrate the outcomes they are driving for our customers with less constraints.

Our Five new Award Categories are:

These categories are designed to bring to life the digital transformation that you’re driving with your customers built on Microsoft technology, whether it’s a solution, a managed service, an application, a new way of doing business, or even a joint venture!

The second big change is how we’re rewarding the winners. Winners will be awarded with customized logos and web banners that allow you to showcase your company as an esteemed Microsoft Partner (for both winners and finalists); custom public relations templates to help promote your award status (for both winners and finalists); recognition collateral to help celebrate your success; congratulatory letters from Microsoft Australia’s General Manager and photo opportunities and meetings with key Microsoft executives at Microsoft Summit as well as some fantastic PR opportunities. Winners will also be invited to an exclusive awards celebration during Microsoft Summit. This event is a unique opportunity to network with Microsoft executives in specific business areas and strengthen relationships with Microsoft business groups.

To learn more about these new awards visit the Microsoft Australia Partner Awards Site and download the award guidelines.

The submission tool is now open and will remain open until August 25 2017.


Sarah

Azure Database for PostgreSQL / MySQL とは

$
0
0

Microsoft Japan Data Platform Tech Sales Team

坂本 禎尚


今年 2017 年の 5 月 10 日から 12 日にかけてシアトルで開催された Build 2017(年次開発者会議)において、オープンソースのリレーショナル データベースである PostgreSQL と MySQL をフルマネジードの PaaS サービスとして Azure 上で提供することを発表しました。

それぞれ、Azure Database for PostgreSQL と Azure Database for MySQL という名称でパブリック プレビューの状態で提供が開始されています。

現状、これらのサービスは東日本、西日本リージョンをはじめとして全部で 11 のリージョンで提供されています。

PaaS のリレーショナル データベースとしては、2010 年から SQL Server を Azure SQL Database としてサービス提供してきており、昨年 2016 年にデータ ウェアハウス専用用途として Azure SQL Data Warehouse を提供開始しました。Azure Database for PostgreSQL と Azure Database for MySQL は、これらに続く新たなリレーショナル データベースの PaaS サービスとして提供されるということになります。

これらのサービス群は Azure Service Fabric 上に構築された Sterling という仕組みの上で稼働しています。Sterling は Azure SQL Database で最初に採用されましたが、Azure SQL Database にはなんら依存しない形で作られているので、今回のような PostgreSQL や MySQL もこの基盤で動かすことができるようになっています。Sterling については、また別の機会があればそこでご紹介します。

それでは、早速、PostgreSQL のデータベースを作ってみましょう。

1. まずは、PostgreSQL サーバーを作成し、必要な Computing Unit (CU) を選択するところまでが最初のステップです。数分でデプロイが完了するはずです。

image


2. 次に、クライアントから接続することができるようにするには、Azure SQL Database や Azure SQL Data Warehouse でもおなじみの Firewall の設定を行い、接続を許可するクライアントの IP アドレスを設定する必要があります。

image


3. PostgreSQL のクライアント ツールは数多くありますが、今回は、pgAdmin から接続してみた結果です。

image


Azure SQL Database と同様、ソフトウェアのインストール作業や面倒な初期設定作業を行うことなく、あっという間に PostgreSQL のデータベース サーバーを立てることができました。

ちなみに、MySQL のデータベースも上記の 1, 2 の手順で同様に立てることができます。


気になるお値段は(プレビュー価格ではありますが)
PostgreSQL : https://azure.microsoft.com/ja-jp/pricing/details/postgresql/
MySQL : https://azure.microsoft.com/ja-jp/pricing/details/mysql/

公式ドキュメント
PostgreSQL : https://docs.microsoft.com/ja-jp/azure/postgresql/
MySQL : https://docs.microsoft.com/ja-jp/azure/mysql/


ご興味のある方は、是非試してみて下さい。

Get Azure PaaS Endpoint IPs

$
0
0

I’ve had a few situations where people are trying to find out the public IP Addresses for their own resources in Azure to use for Network Security Groups or User Defined Routes.

Unfortunately there is nothing generic out there that can return this information for every Resource Type, so specific code needs to be developed for each type.
I’ve made a start on this for Storage Accounts and Azure SQL Servers, being two of the most popular ones.

You can use the function(s) below to return an array containing the IP, Location and Resource Type for all Storage Accounts and SQL Servers in a given subscription.
If you have another Resource Type you need to resolve public IPs for, add the required code under the ‘switch ($Res.ResourceTypes)‘ section.
Please feel free to drop me a line if you need help working out how to get the Public IP for different resource types.

function Get-FQDNIP (
    [string]$FQDN,
    [object]$Resource
) {
    $IPDetails = [System.Net.Dns]::GetHostAddresses($FQDN)
    $IP = New-Object PSObject -Property @{
        IP = $IPDetails.IPAddressToString
        Locn = $Resource.Location
        Type = $Resource.ResourceType
    }
    Write-Verbose "`t$($IP)"
    return $IP
}


function Get-PaaSIPs (
    [string]$SubscriptionID
) {
    Select-AzureRmSubscription -SubscriptionId $SubscriptionID | Out-Null
    $AllRes = Get-AzureRmResource
    $IPs = @()
    $CurrType = ""
    $AllRes = $AllRes | Sort-Object ResourceType
    ForEach ($Res in $AllRes) {
        if ($CurrType -ne $Res.ResourceType) {
            $CurrType = $Res.ResourceType
            Write-Verbose "$($Res.ResourceType)"
        }
        switch ($Res.ResourceType) {
            "Microsoft.Storage/storageAccounts" {
                $ResDet = Get-AzureRmStorageAccount -Name $Res.ResourceName -ResourceGroupName $Res.ResourceGroupName
                $Blob = $null; $Blob = $ResDet.PrimaryEndpoints.Blob
                $File = $null; $File = $ResDet.PrimaryEndpoints.File
                $Table = $null; $Table = $ResDet.PrimaryEndpoints.Table
                $Queue = $null; $Queue = $ResDet.PrimaryEndpoints.Queue

                if ($Blob -ne $null) {
                    $Blob = $Blob.Substring(8,$Blob.Length-9)
                    $IP = Get-FQDNIP -FQDN $Blob -Resource $Res
                    if ($IP.IP -notin $IPs.IP) {
                        $IPs += $IP
                    }
                }
                if ($File -ne $null) {
                    $File = $File.Substring(8,$File.Length-9)
                    $IP = Get-FQDNIP -FQDN $File -Resource $Res
                    if ($IP.IP -notin $IPs.IP) {
                        $IPs += $IP
                    }
                }
                if ($Table -ne $null) {
                    $Table = $Table.Substring(8,$Table.Length-9)
                    $IP = Get-FQDNIP -FQDN $Table -Resource $Res
                    if ($IP.IP -notin $IPs.IP) {
                        $IPs += $IP
                    }
                }
                    if ($Queue -ne $null) {
                    $Queue = $Queue.Substring(8,$Queue.Length-9)
                    $IP = Get-FQDNIP -FQDN $Queue -Resource $Res
                    if ($IP.IP -notin $IPs.IP) {
                        $IPs += $IP
                    }
                }
            }
            "Microsoft.Sql/servers" {
                $IP = Get-FQDNIP -FQDN "$($Res.ResourceName).database.windows.net" -Resource $Res
                if ($IP.IP -notin $IPs.IP) {
                    $IPs += $IP
                }
            }
            default {
                #Write-Verbose "`t$($Res.Name)"
            }
        }
    }
    return $IPs | Sort-Object Locn, IP, Type
}

How the SQLCAT Customer Lab is Monitoring SQL on Linux

$
0
0

Reviewed By: Denzil Ribeiro, Dimitri Furman, Mike Weiner, Rajesh Setlem, Murshed Zaman

Background

SQLCAT often works with early adopter customers, bring them into our lab, and run their workloads. With SQL Server now available on Linux, we needed a way to visualize performance and PerfMon, being a Windows only tool, was no longer an option. After a lot of research on ways to monitor performance in Linux, we didn’t find a de facto standard. However, we did learn that in the open source community there are many ways of accomplishing a goal and that there is no one “right way”, rather choose the way that works best for you.

The following solutions were tested:

  • Graphing with Grafana and Graphite
  • Collection with collectd and Telegraf
  • Storage with Graphite/Whisper and InfluxDB

We landed on a solution which uses InfluxDB, collectd and Grafana. InfluxDB gave us the performance and flexibility we needed, collectd is a light weight tool to collect system performance information, and Grafana is a rich and interactive tool for visualizing the data.
In the sections below, we will provide you with all the steps necessary to setup this same solution in your environment quickly and easily. Details include step-by-step setup and configuration instructions, along with a pointer to the complete GitHub project.

Solution Diagram

Here is the high-level architecture of how this solution works. Collectd continuously runs in a container on your SQL Server on Linux environment and pushes metrics to InfluxDB. The data is then visualized via the Grafana dashboard, which reads data from InfluxDB when Grafana requests it.

Setup

When we found a set of tools that let us easily visualize the performance for troubleshooting purposes , we wanted to provide an easy, repeatable method for deployment using Docker. The directions below will walk you through setting this up using our Docker images. The complete mssql-monitoring GitHub project can be found here. Give it a try, we welcome feedback on your experience.

Prerequisites

  1. Access to docker.io and GitHub for pulling Docker images and accessing the GitHub repository.
  2. 1 – 2 Linux machines for running InfluxDB and Grafana, depending on how large your deployment is.
  • If using 2 machines, 1 machine will be used for hosting the InfluxDB container and the second machine will be used for hosting the Grafana container
  • If using 1 machine, it will be used for hosting both the InfluxDB and Grafana containers.
  • InfluxDB opened ports: 25826 (default inbound data to InfluxDB), 8086 (default outbound queries from Grafana)
  • Grafana opened port: 3000 (default web port for inbound connections)
  • A SQL Server on Linux machine or VM that you would like to monitor.
  • Setting up InfluxDB

    For sizing InfluxDB, you can refer to the InfluxDB documentation. Also, note that it is recommended to provision SSD volumes for the InfluxDB data and wal directories. In our experience this has not been necessary when monitoring just a few machines.

    1. Install Docker Engine (if not already installed)
      • For RHEL:
        yum install docker -y
      • For Ubuntu:
        wget -qO- https://get.docker.com/ | sudo sh
    2. Install Git for your distro (if not already installed)
      • For RHEL:
        yum install git -y
      • For Ubuntu:
        apt-get install git -y
    3. Clone the mssql-monitoring GitHub repository
    4. git clone https://github.com/Microsoft/mssql-monitoring.git
    5. Browse to mssql-monitoring/influxdb
    6. cd mssql-monitoring/influxdb
    7. Edit run.sh and change the variables to match your environment
    8. Execute run.sh. This will pull down the mssql-monitoring-InfluxDB image and create and run the container

    Setting up collectd on the Linux SQL Server you want to monitor

    Note: These commands have to be run on the SQL Server on Linux VM/box that you want to monitor

    1. Install Docker Engine (if not already installed)
      • For RHEL:
        yum install docker -y
      • For Ubuntu:
        wget -qO- https://get.docker.com/ | sudo sh
    2. Install Git for your distro (if not already installed)
      • For RHEL:
        yum install git -y
      • For Ubuntu:
        apt-get install git -y
    3. Clone the mssql-monitoring GitHub repository
    4. git clone https://github.com/Microsoft/mssql-monitoring.git
    5. Browse to mssql-monitoring/collectd
    6. cd mssql-monitoring/collectd
    7. Edit run.sh and change the variables to match your environment
    8. Execute run.sh. This will pull down the mssql-monitoring-collectd image, set it to start on reboot and create and run the container

    Setting up Grafana

    If you are doing a small scale setup (monitoring a few machines), you should be fine running this on the same host as your InfluxDB container. We use the image created by Grafana Labs with an addition of a run.sh file that you can use to create and run the container.

    1. Install Docker Engine (if not already installed)
      • For RHEL:
        yum install docker -y
      • For Ubuntu:
        wget -qO- https://get.docker.com/ | sudo sh
    2. Install Git for your distro (if not already installed)
      • For RHEL:
        yum install git -y
      • For Ubuntu:
        apt-get install git -y
    3. Clone the mssql-monitoring GitHub repository
    4. git clone https://github.com/Microsoft/mssql-monitoring.git
    5. Browse to mssql-monitoring/grafana
    6. cd mssql-monitoring/grafana
    7. Edit run.sh and change the variables to match your environment
    8. Run run.sh. This will pull down the mssql-monitoring-grafana image and create and run the container

    Configuring the InfluxDB data source in Grafana

    In order for Grafana to pull data from InfluxDB, we will need to setup the data source in Grafana.

    1. Browse to your Grafana instance
    • http://[GRAFANA_IP_ADDRESS]:3000
    • Login with default user admin and password admin
  • Click “Add data source”
    • Name: influxdb
    • Type: InfluxDB
    • Url: http://[INFLUXDB_IP_ADDRESS]:8086
    • Database: collectd_db
  • Click “Save & Test”
  • Importing Grafana dashboards

    We have a set of dashboards that we use and have made available to the community. These dashboards are included in the GitHub repository: mssql-monitoring. Just download them and import them in Grafana. Once the dashboards are imported, you will see metrics that collectd, running on your SQL Server, is pushing to InfluxDB.

    How the data gets loaded

    In this solution, we leverage collectd and several plugins to get data from the system(s) we are monitoring. Specifically, on the SQL Server side, we leverage the collectd DBI plugin with the FreeTDS driver, and execute the following queries every 5 seconds, using sys.dm_os_performance_counters and sys.dm_wait_stats DMVs. You can view the complete collectd.conf file here. These specific counters and waits provided a good starting point for us, but you can experiment and change as you see fit.

    sys.dm_os_performance_counters query

    For this query, we needed to replace spaces with underscores in counter and instance names to make them friendly for InfluxDB. We also do not need to reference the counter type field (cntr_type) since the logic to do the delta calculation is done in Grafana with the non-negative derivative function. To find out more about counter types and implementation, please see: Querying Performance Counters in SQL Server by Jason Strate and Collecting performance counter values from a SQL Azure database by Dimitri Furman

    SELECT Replace(Rtrim(counter_name), ' ', '_')  AS counter_name,
           Replace(Rtrim(instance_name), ' ', '_') AS instance_name,
           cntr_value
    FROM   sys.dm_os_performance_counters
    WHERE  ( counter_name IN ( 'SQL Compilations/sec',
    							'SQL Re-Compilations/sec',
    							'User Connections',
    							'Batch Requests/sec',
    							'Logouts/sec',
    							'Logins/sec',
    							'Processes blocked',
    							'Latch Waits/sec',
    							'Full Scans/sec',
    							'Index Searches/sec',
    							'Page Splits/sec',
    							'Page Lookups/sec',
    							'Page Reads/sec',
    							'Page Writes/sec',
    							'Readahead Pages/sec',
    							'Lazy Writes/sec',
    							'Checkpoint Pages/sec',
    							'Database Cache Memory (KB)',
    							'Log Pool Memory (KB)',
    							'Optimizer Memory (KB)',
    							'SQL Cache Memory (KB)',
    							'Connection Memory (KB)',
    							'Lock Memory (KB)',
    							'Memory broker clerk size',
    							'Page life expectancy' ) )
    OR ( instance_name IN ( '_Total',
    						'Column store object pool' )
    AND counter_name IN ( 'Transactions/sec',
    						'Write Transactions/sec',
    						'Log Flushes/sec',
    						'Log Flush Wait Time',
    						'Lock Timeouts/sec',
    						'Number of Deadlocks/sec',
    						'Lock Waits/sec',
    						'Latch Waits/sec',
    						'Memory broker clerk size',
    						'Log Bytes Flushed/sec',
    						'Bytes Sent to Replica/sec',
    						'Log Send Queue',
    						'Bytes Sent to Transport/sec',
    						'Sends to Replica/sec',
    						'Bytes Sent to Transport/sec',
    						'Sends to Transport/sec',
    						'Bytes Received from Replica/sec',
    						'Receives from Replica/sec',
    						'Flow Control Time (ms/sec)',
    						'Flow Control/sec',
    						'Resent Messages/sec',
    						'Redone Bytes/sec')
    OR ( object_name = 'SQLServer:Database Replica'
    AND counter_name IN ( 'Log Bytes Received/sec',
    						'Log Apply Pending Queue',
    						'Redone Bytes/sec',
    						'Recovery Queue',
    						'Log Apply Ready Queue')
    AND instance_name = '_Total' ) )
    OR ( object_name = 'SQLServer:Database Replica'
    AND counter_name IN ( 'Transaction Delay' ) )
    

    sys.dm_os_wait_stats query

    WITH waitcategorystats ( wait_category,
    						wait_type,
    						wait_time_ms,
    						waiting_tasks_count,
    						max_wait_time_ms)
        AS (SELECT CASE
    				WHEN wait_type LIKE 'LCK%' THEN 'LOCKS'
                    WHEN wait_type LIKE 'PAGEIO%' THEN 'PAGE I/O LATCH'
                    WHEN wait_type LIKE 'PAGELATCH%' THEN 'PAGE LATCH (non-I/O)'
                    WHEN wait_type LIKE 'LATCH%' THEN 'LATCH (non-buffer)'
                    ELSE wait_type
                    END AS wait_category,
                    wait_type,
                    wait_time_ms,
                    waiting_tasks_count,
                    max_wait_time_ms
    	FROM   sys.dm_os_wait_stats
    	WHERE  wait_type NOT IN ( 'LAZYWRITER_SLEEP',
    			'CLR_AUTO_EVENT',
    			'CLR_MANUAL_EVENT',
    			'REQUEST_FOR_DEADLOCK_SEARCH',
    			'BACKUPTHREAD',
    			'CHECKPOINT_QUEUE',
    			'EXECSYNC',
    			'FFT_RECOVERY',
    			'SNI_CRITICAL_SECTION',
    			'SOS_PHYS_PAGE_CACHE',
    			'CXROWSET_SYNC',
    			'DAC_INIT',
    			'DIRTY_PAGE_POLL',
    			'PWAIT_ALL_COMPONENTS_INITIALIZED',
    			'MSQL_XP',
    			'WAIT_FOR_RESULTS',
    			'DBMIRRORING_CMD',
    			'DBMIRROR_DBM_EVENT',
    			'DBMIRROR_EVENTS_QUEUE',
    			'DBMIRROR_WORKER_QUEUE',
    			'XE_TIMER_EVENT',
    			'XE_DISPATCHER_WAIT',
    			'WAITFOR_TASKSHUTDOWN',
    			'WAIT_FOR_RESULTS',
    			'SQLTRACE_INCREMENTAL_FLUSH_SLEEP',
    			'WAITFOR',
    			'QDS_CLEANUP_STALE_QUERIES_TASK_MAIN_LOOP_SLEEP',
    			'QDS_PERSIST_TASK_MAIN_LOOP_SLEEP',
    			'HADR_FILESTREAM_IOMGR_IOCOMPLETION',
    			'LOGMGR_QUEUE',
    			'FSAGENT' )
    	AND wait_type NOT LIKE 'PREEMPTIVE%'
    	AND wait_type NOT LIKE 'SQLTRACE%'
    	AND wait_type NOT LIKE 'SLEEP%'
    	AND wait_type NOT LIKE 'FT_%'
    	AND wait_type NOT LIKE 'XE%'
    	AND wait_type NOT LIKE 'BROKER%'
    	AND wait_type NOT LIKE 'DISPATCHER%'
    	AND wait_type NOT LIKE 'PWAIT%'
    	AND wait_type NOT LIKE 'SP_SERVER%')
    SELECT wait_category,
           Sum(wait_time_ms)        AS wait_time_ms,
           Sum(waiting_tasks_count) AS waiting_tasks_count,
           Max(max_wait_time_ms)    AS max_wait_time_ms
    FROM   waitcategorystats
    WHERE  wait_time_ms > 100
    GROUP  BY wait_category
    

    Dashboard Overview

    With the metrics that we collect from the collectd system plugins and the DBI plugin, we are able to chart the following metrics over time and in near real time, with up to 5 second data latency. The following are a snapshot of metrics that we graph in Grafana (Clicking the images will enlarge them).

    Core Server Metrics

    Core SQL Metrics

    Application Insights Performance Profiler

    $
    0
    0

    I’ve been asked recently about performance profilers for various apps, and so I took another look at App Insights to see what’s new/different/interesting in that space.

    Luckily, I ran across this: https://docs.microsoft.com/en-us/azure/application-insights/app-insights-profiler, which is super-awesome, and seem to work for ASP.NET Core (aspnetcore) apps as well!  Here’s a screenshot of the vanilla aspnetcore MVC app, hosted in a basic web app, after being thrashed by 100k hits to the “home” and “about” pages.


    Check It out!

    Should you warn users when they receive an external message?

    $
    0
    0

    I’ve been asked a few times what I think about organizations that add warnings to messages that their users receive when the message is sent to them from outside the organization. That is, some organizations create Exchange Transport Rules (ETRs) when the message is received outside the organization. This might look something like this:

    This is an external message

    Or, sometimes it’s bolded:

    This message came from outside the organization

    Or, sometimes it’s bold and red:

    This message came from outside. Please exercise caution when opening attachments.

    Or, sometimes it’s bold, red, and contains asterisks:

    *** This message came from outside. Please be careful when replying to it ***

    I was on a call recently, and a customer asked me what I think about this. I’ve also been on internal email threads where it similarly comes up. And also, would we ever consider adding this to Safety Tips?

    My view on warnings of this type is one of mixed feelings.

    The advantages of warning on external messages

    On the one hand, I get why a company would do this. The majority (but not 100%) of phishing attempts come from outside the organization. Phishers are trying to get users to click on links; open attachments; or reply back with sensitive information such as HR personnel files, or making wire transfers. So, by adding these disclaimers, they are trying to get users to be more vigilant and pay attention to the fact that the message comes from the outside, and therefore might be suspicious.

    The drawbacks of warning on external messages

    On the other hand, I’m not sure how effective this is for actually changing user behavior.

    The majority of external messages that land in your inbox are legitimate. I get plenty of spam but nearly all of it goes to Junk, or is rejected at the network edge and I never see it. Almost everything I see in my own inbox is fine, and it’s like this for the majority of people.

    By adding disclaimers to messages when they are external, the user learns to associate the warning at the top with something that is not malicious. By seeing so many benign messages with a warning, the user has been trained to ignore them since they were providing no value (that is, being careful on external messages yielded the same results as not being careful on internal messages). And then, when a malicious message actually does arrive from the outside, because they’ve been conditioned to seeing warnings on messages without any malicious content, the average user still goes ahead and clicks on the link or opens the attachment. And therefore, the external warning has added no value.

    It’s kind of like Syndrome from the movie The Incredibles. His evil plan was to give everyone super powers, because when everyone was super, no one would be.

    My own experience

    Speaking for myself, I recently noticed (!) in Outlook that when I sent emails to external people, it warns me:

    And here’s what it looks like in Outlook Web Access:

    Even for me, I wasn’t really paying attention to those warnings because (a) they look similar to other notifications that I get in the email client (e.g., Out-of-Office replies), and (b) virtually all external messages that I send are legitimate.

    When it comes to Safety Tips, we are hyper-aware that we don’t want to overtip because of exactly this problem. People complain regularly when a message arrives with the red fraud detection tip – even when the message truly is fraudulent! On the other hand, there is a lot of spoofing email out there that contains this tip and the message content is “legitimate”, so we do have evidence that people don’t want noisy notifications.

    We’ve also experimented by adding a safety tip to a few more scenarios, and tested it internally. It was a gray safety tip and examined communications between people and added a tip when it deviated from an established pattern.

    The feedback from that experiment was not positive. Even though it was only a gray tip, people didn’t like it. It was unclear to them that the the tip was adding any value in the case when a message was not suspicious, and that turned out to be the majority of the cases.

    So, the moral of the story is: Warn users when you have something to warn. The criteria has to be specific.

    But maybe there’s a place for warning on external messages?

    I guess the answer to the question of what I think about external warnings on all messages is: Your mileage may vary.

    • Perhaps it works for some users who get so few external messages that it’ll work for them since they don’t normally need to differentiate between external and internal
      .
    • Perhaps it works for to add warnings but suppress them when it comes from a trusted source (that is, adding an exclusion to the ETR). But then this forces you into maintaining allow lists, and this list will become long and hard to maintain
      .
    • Perhaps users really do pay attention to it and alter their behavior internally. That may be, but I’ve seen more evidence that it works when you use it sporadically rather than regularly

    But having said all that, you may still find it useful to add these external warnings.

    <shrug>

    If that’s what you want to do, it’s up to you.


    주간닷넷 2017년 6월 14일

    $
    0
    0

    On .NET 소식 : Mattias Karlsson – Cake 개발자

    MS 빌드 컨퍼런스 기간 중 여러 참가자와 인터뷰를 진행했었습니다. 그중 Mattias Karlsson과의 인터뷰를 공유해드리고자 합니다. Mattias Karlsson는 C#과 DSL 기술을 기반으로 한 자동 빌드 시스템 Cake의 오픈소스 프로젝트 핵심 참여자 이기도 합니다

    금주의 패키지: Topshelf

    Topshelf는 서비스 호스팅을 위한 프레임워크로 .NET 기반으로 구현되었습니다. 개발자가 서비스의 생성, 디버깅 및 인스톨을 쉽고 간단하게 구성 할 수 있도록 도와줍니다.

    public class TownCrier
    {
        readonly Timer _timer;
        public TownCrier()
        {
            _timer = new Timer(1000) {AutoReset = true};
            _timer.Elapsed += (sender, eventArgs) =>
                Console.WriteLine($"It is {DateTime.Now} and all is well");
        }
        public void Start() { _timer.Start(); }
        public void Stop() { _timer.Stop(); }
    }
    
    public class Program
    {
        public static void Main()
        {
            HostFactory.Run(x =>
            {
                x.Service(s =>
                {
                   s.ConstructUsing(name=> new TownCrier());
                   s.WhenStarted(tc => tc.Start());
                   s.WhenStopped(tc => tc.Stop());
                });
                x.RunAsLocalSystem();
    
                x.SetDescription("Sample Topshelf Host");
                x.SetDisplayName("TownCrier");
                x.SetServiceName("TownCrier");
            });
        }
    }

    .NET 소식

    ASP.NET 소식

    C# 소식

    F# 소식

    VB 소식

    Xamarin 소식

    Azure 소식

    UWP 소식

    Data 소식

    Game development 소식

    주간닷넷.NET Blog에서 매주 발행하는 The week in .NET을 번역하여 진행하고 있으며, 한글 번역 작업을 오픈에스지의 송기수 전무님의 도움을 받아 진행하고 있습니다.

    song 송 기수, 기술 전무, 오픈에스지
    현재 개발 컨설팅회사인 OpenSG의 기술이사이며 여러 산업현장에서 프로젝트를 진행중이다. 입사 전에는 교육 강사로서 삼성 멀티캠퍼스 교육센터 등에서 개발자 .NET 과정을 진행해 왔으며 2005년부터 TechED Korea, DevDays, MSDN Seminar등 개발자 컨퍼런스의 스피커로도 활동하고있다. 최근에는 하루 업무의 대다수 시간을 비주얼 스튜디오와 같이 보내며 일 년에 한 권 정도 책을 쓰고, 한달에 두 번 정도 강의를 하면 행복해질 수 있다고 믿는 ‘Happy Developer’ 이다.

    Menu de opciones para Arduino

    $
    0
    0

    El fin de semana me solicitaron ayuda para crear un menú de opciones para Arduino, la idea es usar un teclado de entrada (en este caso un keypad 4×4) y permitir ingresar una opción y a continuación una cantidad; el código es bastante fácil pero muchas veces se tiene problemas para expresarlo dentro del método loop. Dado que este parece ser un problema común les comparto el código de ejemplo, quizás le pueda servir a alguien más.

    #include <Keypad.h>
    
    const byte ROWS = 4;
    const byte COLS = 4;
    
    char keys[ROWS][COLS] = {
    	{ '1','2','3','A' },
    	{ '4','5','6','B' },
    	{ '7','8','9','C' },
    	{ '*','0','#','D' }
    };
    byte rowPins[ROWS] = { 9, 8, 7, 6 };
    byte colPins[COLS] = { 5, 4, 3, 2 };
    Keypad keypad = Keypad(makeKeymap(keys), rowPins, colPins, ROWS, COLS);
    char key, option;
    int quantity;
    bool flag;
    
    void setup() {
    	Serial.begin(9600);
    	Serial.print("Iniciando menu...");
    }
    
    void loop() {
    	quantity = 0;
    	Serial.println("Seleccione una opcion (A-D):");
    	flag = true;
    	while (flag) {
    		key = keypad.getKey();
    		if (key) {
    			switch (key)
    			{
    			case 'A':
    			case 'B':
    			case 'C':
    			case 'D':
    				Serial.println(key);
    				option = key;
    				flag = false;
    				break;
    			default:
    				break;
    			}
    		}
    	}
    	Serial.println("Ingrese una cantidad :");
    	Serial.println("(Presione '#' para finalizar)");
    	flag = true;
    	while (flag) {
    		key = keypad.getKey();
    		if (key) {
    			switch (key)
    			{
    			case '0':
    			case '1':
    			case '2':
    			case '3':
    			case '4':
    			case '5':
    			case '6':
    			case '7':
    			case '8':
    			case '9':
    				Serial.print(key);
    				quantity = quantity * 10 + key - '0';
    				break;
    			case '#':
    				Serial.println();
    				flag = false;
    			default:
    				break;
    			}
    		}
    	}
    }
    

    Hasta la próxima!
    –Rp

    Experiencing Data Access Issue in Azure Portal for Many Data Types – 07/03 – Resolved

    $
    0
    0
    Final Update: Monday, 03 July 2017 20:45 UTC

    We’ve confirmed that all our systems are back to normal with no customer impact as of 07/03, 20:31 UTC. Our logs show the incident started on 07/03, 18:14 UTC and that during the 2 hours 17 minutes hours that it took to resolve the issue around 24% of the customers experienced failures in data access through Azure Portal.
    • Root Cause: The failure was due to one of the back-end platform services not responding to the queries, which resulted  in data access failures.
    • Incident Timeline: 2 Hours & 17 minutes – M/D,  07/03, 18:14 UTC through 07/03, 20:31 UTC

    We understand that customers rely on Application Insights as a critical service and apologize for any impact this incident caused.

    -Sapna


    Initial Update: Monday, 03 July 2017 18:30 UTC

    We are aware of issues within Application Insights and are actively investigating. Some customers may experience Data Access Issue in Azure Portal. The following data types are affected: Availability,Customer Event,Exception,Metric,Page Load,Page View,Trace
    • Work Around: None
    • Next Update: Before 07/03 21:30 UTC

    We are working hard to resolve this issue and apologize for any inconvenience.


    -Sapna


    Most Common Mistakes Growing Startups Make

    $
    0
    0

    Guest post by James Burbank, editor in chief at BizzMarkBlog

    Trying to put all of the growing startups in a single bag is probably a big mistake since startups grow in size, workload and revenue for all kinds of reasons and under all kinds of circumstances. Still, the mistakes these growing startups make tend to make are so very similar that one feels there is definitely some logic to seeing them all as one relatively homogenous group.

    These mistakes need to be identified and talked about as often as possible, hopefully helping startup owners recognize the various potential hazardous paths before they make too many steps on them.

    Not Introducing Structure

    For the most part, startups tend to be somewhat chaotic entities whose inception is often quite improvised and which can survive the early days without having too much structure. When a startup consists of a few close people, they do not need clearly defined procedures for every little thing. It develops in an organic way and even if there are problems, they are identified quickly and can be solved without too much backtracking.

    Once the startup starts to grow, this is no longer true. Once you have half a dozen more people working on ten times as many processes, lack of structure turns into the worst kind of chaos – destructive and time-consuming. There is too much going on at any given time and there are too many people involved.

    Informal communication can only handle so much.

    Every growing startup needs to adopt some structure and set up standard procedures for all kinds of tasks, from the smallest to the biggest. It may feel to some people as if their beloved startup is going corporate, but the basic human and business truths dictate that structure is crucial for any growing startup’s success.

    Changing Too Much of Too Little

    Running a successful startup is all about balance. The mere fact that startups are mostly lean companies means that they have to do quite a bit of balancing to simply stay alive. Once a startup is ‘out of the woods’, its founders and/or management have to do perhaps the most difficult balancing act.

    Namely, a growing startup simply cannot remain that same company that it was in its earliest days. Its customer base is growing, its product is evolving, its financial situation is entirely different. Sticking to what had worked in the past would be the safest way to ruin, the only variable which aspect of it would fail first.

    On the other hand, startups that decide to change too much are also risking a lot. For example, a startup that makes too significant modifications to its product risks seeing its most loyal customers leave. An irresponsible handing out of equity can cause early holders to start rethinking their position which can lead to a whole slew of various problems.

    In essence, a startup needs to understand its changing realities, move with them, but still remember what it is that makes it unique and what has put it in a situation where it is growing.

    Making Personnel Mistakes

    Depending on what a startup is about and how it is making money, its personnel needs will differ more or less from other startups. Often times, these are tiny differences that one could easily oversee. For instance, one startup that develops machine learning software might need an extra coder or two while another startup that develops machine learning software might actually be in need of a tester.

    One of those startups might also need someone on the business side of things, handling stuff like cash flow issues while the other might need an HR person more since their employees are leaving at an alarming rate.

    Things only get more complex once you start factoring in the experience, the skillsets and everything else that usually goes into the hiring process. Add to this the need for senior management and adjunct departments and you got yourself a personnel minefield that you cannot tread carefully enough.

    That does not mean you shouldn’t try. You should always try. Read up on it. Perhaps even hire an outside advisor or a company to handle your personnel needs.

    Closing Word

    A growing startup is more fragile than it seems. Sure, it has survived the growing pains, but the next step is just as sensitive.

    Remember what your startup is about, instil structure to it and be smart about who you bring on.

    It should be enough to prevent catastrophes.


    Guest Post Tim Sands, Splendid Suggestions: The Splendid Suggestions top 5 marketing sessions at Microsoft Inspire 2017

    $
    0
    0


    Tim Sands
    Co-Founder & Director
    Splendid Suggestions


    As I’m constantly trying to explain to my wife in Australia, Microsoft Inspire is no mere junket. Sure, there may some “networking” involved, but it’s too far to go and there’s too much to learn to not dive into the world-class sessions on offer.

    However as a first-time attendee it can all be very daunting. So many sessions, so much expertise on offer, and as always so little time. To help narrow things down, I asked myself a simple question. Why is Splendid Suggestions going to Microsoft Inspire in 2017..?

    As a company we have a single-minded focus – helping Microsoft channel partners drive their business growth by engaging with new and existing customers. So keeping that reason firmly in mind, the MyInspire Session Scheduler uncovered a few gems. Here are my top five:


    1.      ACCELERATING CLOUD CUSTOMER ACQUISITION: ADJUSTING TO BUYER 2.0

    Behavioural economics has been a buzzword in advertising for some time now, as behavioural science paired with “design led” problem-solving sounds like an alluring mix when attempting to nudge someone along the buying cycle. In reality though, it rarely gets beyond the theory, with academics and creative teams struggling to get aligned enough for a campaign to get out the door. However the speaker of this session, Mark Stuyt, is a genuine heavyweight and by combining the latest in neuroscience research with next generation devices, and sharing real life B2B IT implementation stories, well… shut up and take my money..!

    Day/Time: Wednesday, 12-July 3:40 PM-4:00 PM Room/Location: 150B / Level 100 Speaker: Mark Stuyt, Neural Impact Inc.

    2.      50 TIPS IN 50 MINUTES – SMART PARTNER MARKETING 

    Good ideas can come from anywhere… they’re just more likely to come from a panel loaded with industry experts, who are tasked with throwing rapid fire tips at you. In an industry where it’s easy to drown in creative, content and channel options, figuring out what to do can involve troubled waters. Proven tactics that are quick to implement and will provide immediate results are little lifebuoys of marketing gold. The promise of walking away with four or five ideas and a solid list of ‘to dos’ that might just shift the marketing needle will be an hour well spent.

    Day/Time: Wednesday, 12-July 2:30 PM-3:30 PM Room/Location:  207A / Level 200 Speakers: Chris Dunning, TechQuarters; Eric Rabinowitz, Nurture Marketing, LLC; Jeff Hilton, Alliance For Channel Success; Jennifer Tomlinson, Microsoft Corporation

    3.      THE ROLE OF MARKETING IN A TRANSFORMING COMPANY

    There are Big Picture Players and then there is Chris Capossela, Chief Marketing Officer of Microsoft. It’s no secret that Microsoft has kicked some serious goals in recent years, with brand perception, product innovation and share price all soaring upwards. While his title is enough to get me along to this session, his first-hand account of the role played by marketing in Microsoft’s stunning “post-Balmer” transformation should be fascinating.

    Day/Time: Tuesday, 11-July 2:30 PM-3:30 PM Room/Location: 201 / Level 200 Speakers: Chris Capossela, Microsoft

    4.      CREATING STORIES THAT BRING HOME THE BACON

    There is nothing more powerful than having your customers talk to their peers about how awesome you are. All too often amazing customer stories can be told poorly, or not leveraged as well as they could be. We all work hard to first understand, and then deliver great results against our customers objectives… however creating raving fans out of your customer base is also one of the best things you can do as a marketer. And the reality is that all of us can get better at this. This session was a sell out in Toronto in 2016. I’ll be there this year with bells on.

    Day/Time: Monday, 10-July 2:30 PM-3:30 PM Room/Location: 204BC / Level 200 Speaker: Julie Simpson, ResourceiT Consulting Ltd

    5.      MARKETING IN A SAAS BASED WORLD: THE END OF THE EA

    We’ve been hearing about SaaS and marketing working together like ebony and ivory for what seems like forever. It’s not a new conversation. However for our agency, and for many of our peers, B2B campaigns with a significant ‘as a service’ component have jumped from 50% to more than 80% in the space of 12 months. Subscription modelling isn’t the future, it’s now. This session promises to help us understand the complexities, potential pitfalls and the pros and cons of incorporating SaaS subscriptions into campaigns. It’s a prerequisite for any marketer in the IT B2B landscape.

    Day/Time: Tuesday, 11-July 4:00 PM-4:30 PM  Room/Location: Community Hub Theater / The Commons  Speaker: Chris Wright, FiftyFiveandFive; Kevin Conroy

    About Tim Sands

    Tim Sands is Managing Director of Splendid Suggestions, an ad agency that specialises purely in B2B IT communications. With over a decade of B2B IT experience, Tim has a proven track record of developing communications programs that change the way people think about and purchase technology solutions. An ADMA and Echo award winner, he offers a strong mix of strategy development, creative excellence, and digital project delivery with core specialities of customer acquisition and relationship management.


    Getting IDs to use with the Package DSC resource

    $
    0
    0

    One of the questions I get from customers who are looking at using the Package DSC resource to install MSI’s and executables is “What is the ProductID for the installer I want to run?”. If you look at the documentation the ProductID is meant to be a unique identified for the product you are installing, but how can you figure out what the correct value for any given installation is? Lucky for us you can actually use a little bit of PowerShell to look this up after you manually install the product once. Let me give you an example, I recently had to write a DSC script which would install SQL Server Management Studio 17.1 with DSC, so here is the approach I took.

    Step one: Manually install the product somewhere

    This is pretty straightforward – but we need to manually install it once so that we can look up the product ID from the registry after the fact. We can uninstall it after we are done if you like – I tend to provision a quick virtual machine in Azure for this to get the ID and then I can delete the VM after I’m done with it.

    Step two: Find the ID with PowerShell

    Since all the IDs of products that are installed on a machine are stored in the registry, it’s actually quite straightforward to interrogate the registry to get a list of products with their corresponding ID is. Here is the script I use to output the list of installed products:

    $x86Path = "HKLM:SoftwareWow6432NodeMicrosoftWindowsCurrentVersionUninstall*"
    $installedItemsX86 = Get-ItemProperty -Path $x86Path | Select-Object -Property DisplayName, PSChildName
       
    $x64Path = "HKLM:SoftwareMicrosoftWindowsCurrentVersionUninstall*"
    $installedItemsX64 = Get-ItemProperty -Path $x64Path | Select-Object -Property DisplayName, PSChildName
    
    $installedItems = $installedItemsX86 + $installedItemsX64
    $installedItems | Where-Object -FilterScript { $null -ne $_.DisplayName } | Sort-Object -Property DisplayName | Out-GridView

    This will output you a GridView in PowerShell that looks a little like this

    And once we have it in a GridView we can actually add filters pretty easily as well

    Now we can see what the GUID is for SQL Management Studio 17.1 and I can now use this to make a DSC resource

    Step three: Create the DSC resource

    Now that I have the ID I can craft my resource

    Package InstallSSMS
    {
        Ensure = "Present"
        Name = "SSMS-Setup-ENU"
        Path = "C:Softwaressms2016SSMS-Setup-ENU.exe"
        Arguments = "/install /passive /norestart"
        ProductId = "b636c6f4-2183-4b76-b5a0-c8d6422df9f4"
    }
    Here you can see I’ve used the ID we retrieved in step 2 as the ProductId attribute, and that I’m also passing arguments to make sure the installer won’t need any user input (remember, DSC runs in the background so just running the installer on it’s own without those arguments won’t help).


    But that’s all there is to it – a nice simple script to help you figure out the ProductID values to use in your package resource. Happy DSC’ing!


    How to implement the backpropagation using Python and NumPy

    $
    0
    0

    I was recently speaking to a University Academic and we got into the discussion of practical assessments for Data Science Students, One of the key principles students learn is how to implement the back-propagation neural network training algorithm. Many students start by learning this method from scratch, using just Python 3.x and the NumPy package.

    The following is a Guest post by Dr. James McCaffrey Microsoft Research this article was originally published at Visual Studio Magazine the article has been increased to include some additional resources and interactive demos using the Azure Notebooks Service.

    After reading this you should have a solid grasp of back-propagation, as well as knowledge of Python and NumPy techniques that will be useful when working with libraries such as CNTK and TensorFlow. .

    Example using the Iris Dataset

    The Iris Data Set has over 150 item records. Each item has four numeric predictor variables (often called features): sepal length and width, and petal length and width, followed by the species (“setosa,” “versicolor” or “virginica”).

    The demo program uses 1-of-N label encoding

    • setosa = (1,0,0)
    • versicolor = (0,1,0)
    • virginica = (0,0,1)

    The goal is to predict species from sepal and petal length and width.  The 150-item dataset has 50 setosa items, followed by 50 versicolor, followed by 50 virginica. Before writing the demo program,

    There is a 120-item file of training data (using the first 30 of each species) and a 30-item file of test data (the leftover 10 of each species). https://github.com/leestott/IrisData/blob/master/irisTrainData.txt

    The demo program creates a simple neural network with four input nodes (one for each feature), five hidden processing nodes (the number of hidden nodes is a free parameter and must be determined by trial and error), and three output nodes (corresponding to encoded species). The demo loaded the training and test data into two matrices.

    The back-propagation algorithm is iterative and you must supply a maximum number of iterations (50 in the demo) and a learning rate (0.050) that controls how much each weight and bias value changes in each iteration. Small learning rate values lead to slow but steady training. Large learning rates lead to quicker training at the risk of overshooting good weight and bias values. The max-iteration and leaning rate are free parameters.

    The demo displays the value of the mean squared error, every 10 iterations during training. As you’ll see shortly, there are two error types that are commonly used with back-propagation, and the choice of error type affects the back-propagation implementation. After training completed, the demo computed the classification accuracy of the resulting model on the training data (0.9333 = 112 out of 120 correct) and on the test data (0.9667 = 29 out of 30 correct). The classification accuracy on a set of test data is a very rough approximation of the accuracy you’d expect to see on new, previously unseen data.

    The demo program is too long to present in its entirety in this article, but the complete source code is available in the accompanying file download. https://github.com/leestott/IrisData

    Understanding Back-Propagation


    Back-propagation is arguably the single most important algorithm in machine learning. A complete understanding of back-propagation takes a lot of effort. But from a developer’s perspective, there are only a few key concepts that are needed to implement back-propagation. In the discussion that follows, for simplicity I leave out many important details, and take many liberties with the underlying mathematics.

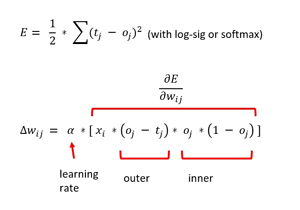
    Take a look at the two math equations for back-propagation. The top equation defines a sum of squares error metric and is the starting point for back-propagation. The tj stands for a target value and the oj stands for a computed output value. Suppose a target value is (1, 0, 0) corresponding to setosa. And suppose that for a given set of weight and bias values, and a set of four input values, the computed output values are (0.70, 0.10, 0.20). The squared error is 1/2 * [ (1 – 0.70)^2 + (0 – 0.10)^2 + (0 – 0.20)^2 ] = 1/2 * (0.09 + 0.01 + 0.04) = 0.07. Notice the seemingly arbitrary 1/2 term.


    Back-Propagation Update for Hidden-to-Output Weights

    The goal of back-propagation training is to minimize the squared error. To do that, the gradient of the error function must be calculated. The gradient is a calculus derivative with a value like +1.23 or -0.33. The sign of the gradient tells you whether to increase or decrease the weights and biases in order to reduce error. The magnitude of the gradient is used, along with the learning rate, to determine how much to increase or decrease the weights and biases.

    Using some very clever mathematics, you can compute the gradient. The bottom equation is the weight update rule for a single output node. The amount to change a particular weight is the learning rate (alpha) times the gradient. The gradient has four terms. The xi is the input associated with the weight that’s being examined. The (oj – tj) is the derivative of the outside part of the error function: the 2 exponent drops to the front, cancelling the 1/2 (which is the only reason the 1/2 term is there), then you multiply by the derivative of the inside, which is -1 times the derivative of the function used to compute the output node.

    The third and fourth terms of the gradient come from the activation function used for the output nodes. For classification, this is the softmax function. As it turns out, the derivative of an output node oj is, somewhat surprisingly, oj * (1 – oj). To summarize, the back-propagation weight update rule depends on the derivative of the error function and the derivative of the activation function.

    There are some important additional details. The squared error term can be defined using (target -output)^2 instead of (output – target)^2 and give the same error because of the squaring operation. But reversing the order will change the sign of the resulting (target – output) term in the gradient. This in turn affects whether you should add the delta-w term or subtract it when you update weights and biases.

    OK, so updating the weights and biases for hidden-to-output weights isn’t too difficult. But what about the weight update rule for input-to-hidden weights? That equation is more complicated and in my opinion is best understood using code rather than a math equation, as I’ll present shortly. The Wikipedia article on back-propagation has a very good derivation of the weight update rule for both output and hidden nodes.

    Overall Demo Program Structure


    The overall demo program structure is presented in Listing 1.

    To edit the demo program, I commented the name of the program and indicated the Python version used. I added four import statements to gain access to the NumPy package’s array and matrix data structures, and the math and random modules. The sys module is used only to programmatically display the Python version, and can be omitted in most scenarios.

    Listing 1: Overall Program Structure https://github.com/leestott/IrisData/blob/master/nn_backprop.py

    # nn_backprop.py
    # Python 3.x
    
    import numpy as np
    import random
    import math
    import sys
    
    # ------------------------------------
    
    def loadFile(df): . . .
    def showVector(v, dec): . . .
    def showMatrix(m, dec): . . .
    def showMatrixPartial(m, numRows, dec, indices): . . .
    
    # ------------------------------------
    
    class NeuralNetwork: . . .
    
    # ------------------------------------
    
    def main():
      print("nBegin NN back-propagation demo n")
      pv = sys.version
      npv = np.version.version
      print("Using Python version " + str(pv) +
        "n and NumPy version "  + str(npv))
    
      numInput = 4
      numHidden = 5
      numOutput = 3
      print("nCreating a %d-%d-%d neural network " %
        (numInput, numHidden, numOutput) )
      nn = NeuralNetwork(numInput, numHidden, numOutput, seed=3)
    
      print("nLoading Iris training and test data ")
      trainDataPath = "irisTrainData.txt"
      trainDataMatrix = loadFile(trainDataPath)
      print("nTest data: ")
      showMatrixPartial(trainDataMatrix, 4, 1, True)
      testDataPath = "irisTestData.txt"
      testDataMatrix = loadFile(testDataPath)
    
      maxEpochs = 50
      learnRate = 0.05
      print("nSetting maxEpochs = " + str(maxEpochs))
      print("Setting learning rate = %0.3f " % learnRate)
      print("nStarting training")
      nn.train(trainDataMatrix, maxEpochs, learnRate)
      print("Training complete")
    
      accTrain = nn.accuracy(trainDataMatrix)
      accTest = nn.accuracy(testDataMatrix)
    
      print("nAccuracy on 120-item train data = %0.4f " % accTrain)
      print("Accuracy on 30-item test data   = %0.4f " % accTest)
    
      print("nEnd demo n")
    
    if __name__ == "__main__":
      main()
    
    # end script
    ----------------------------------------------------------------------------------

    The demo program consists mostly of a program-defined NeuralNetwork class. I created a main function to hold all program control logic. I started by displaying some version information:

    def main():
      print("nBegin NN back-propagation demo n")
      pv = sys.version
      npv = np.version.version
      print("Using Python version " + str(pv) +
        "n and NumPy version "  + str(npv))
    ...

    Next, I created the demo neural network, like so:

    numInput = 4
    numHidden = 5
    numOutput = 3
    print("nCreating a %d-%d-%d neural network " %
      (numInput, numHidden, numOutput) )
    nn = NeuralNetwork(numInput, numHidden, numOutput, seed=3)

    The NeuralNetwork constructor accepts a seed value to initialize a class-scope random number generator object. The RNG object is used to initialize all weights and bias values to small random numbers between -0.01 and +0.01 using class method initializeWeights. The RNG object is also used during training to scramble the order in which training items are processed. The seed value of 3 is arbitrary.

    The constructor assumes that the tanh function is used for hidden node activation. As you’ll see shortly, if you use a different activation function such as logistic sigmoid or rectified linear unit (ReLU), the back-propagation code for updating the hidden node weights and bias values will be affected.

    The demo loads training and test data using these statements:

    print("nLoading Iris training and test data ")
    trainDataPath = "irisTrainData.txt"
    trainDataMatrix = loadFile(trainDataPath)
    print("nTest data: ")
    showMatrixPartial(trainDataMatrix, 4, 1, True)
    testDataPath = "irisTestData.txt"
    testDataMatrix = loadFile(testDataPath)

    Helper function loadFile does all the work. The function is hardcoded to assume that the source data is comma-delimited, is ordered with features followed by encoded species, and does not have a header line. Writing code from scratch allows you to be very concise, as opposed to writing general-purpose library code, which requires you to take into account all kinds of scenarios and add huge amounts of error-checking code.

    The back-propagation training is invoked like so:

    maxEpochs = 50
    learnRate = 0.05
    print("nSetting maxEpochs = " + str(maxEpochs))
    print("Setting learning rate = %0.3f " % learnRate)
    print("nStarting training")
    nn.train(trainDataMatrix, maxEpochs, learnRate)
    print("Training complete")

    Behind the scenes, method train uses the back-propagation algorithm and displays a progress message with the current mean squared error, every 10 iterations. It’s important to monitor progress during neural network training because it’s not uncommon for training to stall out completely, and if that happens you don’t want to wait for an entire training run to complete.

    In non-demo scenarios, the maximum number of training iterations/epochs can be in the thousands, so printing errors every 10 iterations might be too often. You might want to consider passing a parameter to the train method that controls when to print progress messages.

    The demo program concludes with these statements:

    ...
      accTrain = nn.accuracy(trainDataMatrix)
      accTest = nn.accuracy(testDataMatrix)
    
      print("nAccuracy on 120-item train data = %0.4f " % accTrain)
      print("Accuracy on 30-item test data   = %0.4f " % accTest)
    
      print("nEnd demo n")
    
    if __name__ == "__main__":
      main()
    
    # end script

    Notice that during training you’re primarily interested in error, but after training you’re primarily interested in classification accuracy.

    The Neural Network Class
    The structure of the Python neural network class is presented in Listing 2. Python function and method definitions begin with the def keyword. All class methods and data members have essentially public scope as opposed to languages like Java and C#, which can impose private scope. The built-in __init__ method (with two leading and two trailing underscore characters) can be loosely thought of as a constructor. All class method definitions must include the “self” keyword as the first parameter, except for methods that are decorated with the @staticmethod attribute.

    Listing 2: NeuralNetwork Class Structure

    class NeuralNetwork:
      def __init__(self, numInput, numHidden, numOutput, seed): ...
      def setWeights(self, weights): ...
      def getWeights(self): ...
      def initializeWeights(self): ...
      def computeOutputs(self, xValues): ...
      def train(self, trainData, maxEpochs, learnRate): ...
      def accuracy(self, tdata): ...
      def meanSquaredError(self, tdata): ...
    
      @staticmethod
      def hypertan(x): ...
    
      @staticmethod
      def softmax(oSums): ...
    
      @staticmethod
      def totalWeights(nInput, nHidden, nOutput): ...
    
    # end class NeuralNetwork
    ----------------------------------------------------------------------------------

    The NeuralNetwork.train method implements the back-propagation algorithm. The definition begins:

    def train(self, trainData, maxEpochs, learnRate):
      hoGrads = np.zeros(shape=[self.nh, self.no], dtype=np.float32)
      obGrads = np.zeros(shape=[self.no], dtype=np.float32)
      ihGrads = np.zeros(shape=[self.ni, self.nh], dtype=np.float32)
      hbGrads = np.zeros(shape=[self.nh], dtype=np.float32)
    ...

    Each weight and bias has an associated gradient. The prefix “ho” stands for “hidden-to-output.” Similarly, “ob” means “output bias,” “ih” means “input-to-hidden” and “hb” means “hidden bias.” Class members ni, nh, and no are the number of input, hidden, and output nodes, respectively. When working with neural networks, it’s common, but not required, to work with the float32 rather than float64 data type.

    Next, two scratch arrays are instantiated:

    oSignals = np.zeros(shape=[self.no], dtype=np.float32)
    hSignals = np.zeros(shape=[self.nh], dtype=np.float32)

    Each hidden and output node has an associated signal that’s essentially a gradient without its input term. These arrays are mostly for coding convenience.

    The main training loop is prepared like so:

    epoch = 0
    x_values = np.zeros(shape=[self.ni], dtype=np.float32)
    t_values = np.zeros(shape=[self.no], dtype=np.float32)
    numTrainItems = len(trainData)
    indices = np.arange(numTrainItems)

    The x_values and t_values arrays hold a set of feature values (sepal length and width, and petal length and width) and target values (such as 1, 0, 0), respectively. The indices array holds integers 0 through 119 and is used to shuffle the order in which training items are processed. The training loop begins with:

    while epoch < maxEpochs:
      self.rnd.shuffle(indices)
      for ii in range(numTrainItems):
        idx = indices[ii]
    ...

    The built-in shuffle function uses the Fisher-Yates mini-algorithm to scramble the order of the training indices. Therefore, variable idx points to the current training item being processed. Inside the main loop, the input and target values are peeled off the current training item, and then the output node values are computed using the input values and the current weights and bias values:

    for j in range(self.ni):
      x_values[j] = trainData[idx, j]
    for j in range(self.no):
      t_values[j] = trainData[idx, j+self.ni]
    self.computeOutputs(x_values) 

    Note that instead of copying the input values from the matrix of training items into an intermediate x_values array and then transferring those values to the input nodes, you could copy the input values directly. The computeOutputs method stores and returns the output values, but the explicit rerun is ignored here.

    The first step in back-propagation is to compute the output node signals:

    # 1. compute output node signals
    for k in range(self.no):
      derivative = (1 - self.oNodes[k]) * self.oNodes[k]
      oSignals[k] = derivative * (self.oNodes[k] - t_values[k])

    Recall that the derivative variable holds the derivative of the softmax activation function. The oSignals variable includes that derivative and the output minus target value. Next, the hidden-to-output weight gradients are computed:

    # 2. compute hidden-to-output weight gradients using output signals
    for j in range(self.nh):
      for k in range(self.no):
        hoGrads[j, k] = oSignals[k] * self.hNodes[j]

    The output node signal is combined with the associated input from the associated hidden node to give the gradient. As I mentioned earlier, the oSignals array is mostly for convenience and you can compute the values into the hoGrads matrix directly if you wish. Next, the gradients for the output node biases are computed:

    # 3. compute output node bias gradients using output signals
    for k in range(self.no):
      obGrads[k] = oSignals[k] * 1.0

    You can think of a bias as a special kind of weight that has a constant, dummy 1.0 associated input. Here, I use an explicit 1.0 value only to emphasize that idea, so you can omit it if you wish. Next, the hidden node signals are computed:

    # 4. compute hidden node signals
    for j in range(self.nh):
      sum = 0.0
      for k in range(self.no):
        sum += oSignals[k] * self.hoWeights[j,k]
      derivative = (1 - self.hNodes[j]) * (1 + self.hNodes[j])
      hSignals[j] = derivative * sum

    This is the trickiest part of back-propagation. The sum variable accumulates the product of output node signals and hidden-to-output weights. This isn’t at all obvious. You can find a good explanation of how this works by reading the Wikipedia article on back-propagation. Recall that the NeuralNetwork class has a hardcoded tanh hidden node activation function. The derivative variable holds the calculus derivative of the tanh function. So, if you change the hidden node activation function to logistic sigmoid or ReLU, you’d have to change the calculation of this derivative variable.

    Next, the input-to-hidden weight gradients, and the hidden node bias gradients are calculated:

    # 5. compute input-to-hidden weight gradients using hidden signals
    for i in range(self.ni):
      for j in range(self.nh):
        ihGrads[i, j] = hSignals[j] * self.iNodes[i]
    
    # 6. compute hidden node bias gradients using hidden signals
    for j in range(self.nh):
      hbGrads[j] = hSignals[j] * 1.0 

    As before, a gradient is composed of a signal and an associated input term, and the dummy 1.0 input value for the hidden biases can be dropped.

    If you imagine the input-to-output mechanism as going from left to right (input to output to hidden), the gradients must be computed from right to left (hidden-to-output gradients, then input-to-hidden gradients). After all the gradients have been computed, you can update the weights in either order. The demo program starts by updating the input-to-hidden weights

    # 1. update input-to-hidden weights
    for i in range(self.ni):
      for j in range(self.nh):
        delta = -1.0 * learnRate * ihGrads[i,j]
        self.ihWeights[i, j] += delta 

    The weight delta is the learning rate times the gradient. Here, I multiply by -1 and then add the delta because error is assumed to use (target – output)^2 and so the gradient has an (output – target) term. I used this somewhat awkward approach to follow the Wikipedia entry on back-propagation. Of course you can drop the multiply by -1 and just subtract the delta if you wish.

    Next, the hidden node biases are updated:

    # 2. update hidden node biases
    for j in range(self.nh):
      delta = -1.0 * learnRate * hbGrads[j]
      self.hBiases[j] += delta  

    If you look at the loop structure s carefully, you’ll notice that you can combine updating the input-to-hidden weights and updating the hidden biases if you wish. Next, the hidden-to-output weights and the output node biases are updated using these statements:

    # 3. update hidden-to-output weights
    for j in range(self.nh):
      for k in range(self.no):
        delta = -1.0 * learnRate * hoGrads[j,k]
        self.hoWeights[j, k] += delta
    
    # 4. update output node biases
    for k in range(self.no):
      delta = -1.0 * learnRate * obGrads[k]
      self.oBiases[k] += delta 

    Notice that all updates use the same learning rate. An advanced version of back-propagation called Adam (“adaptive moment estimation”) was developed in 2015. Adam uses different learning rates and a few other tricks, and is considered state-of-the-art.

    The main training loop finishes by updating the iteration counter and printing a progress message, and then method NeuralNetwork.train wraps up, like so:

    ...
        epoch += 1
    
        if epoch % 10 == 0:
          mse = self.meanSquaredError(trainData)
          print("epoch = " + str(epoch) + " ms error = %0.4f " % mse)
      # end while
    
      result = self.getWeights()
      return result
    # end train

    Here, a progress message will be displayed every 10 iterations. You might want to parameterize the interval. You can also print additional diagnostic information here. The final values of the weights and biases are fetched by class method getWeights and returned by method train as a convenience.

    Demo

    Using Azure Notebooks I have created a Jupyter version of the experiment this can be found at

    https://notebooks.azure.com/LeeStott-Microsoft/libraries/IrisData 

    You will need to load the data sets into the experiment

    irisTestData.txt
    irisTrainData.txt

    To do this simply select Data –> Upload and upload the two data files

    Simply running the experiment will display the accuracy results

    Begin NN back-propagation demo

    Using Python version 3.5.1 |Anaconda custom (64-bit)| (default, Jun 15 2016, 15:32:45) [GCC 4.4.7 20120313 (Red Hat 4.4.7-1)] and NumPy version 1.11.3

    Creating a 4-5-3 neural network

    Loading Iris training and test data

    Test data:

    [ 0] 5.1 3.5 1.4 0.2 1.0 0.0 0.0
    [ 1] 4.9 3.0 1.4 0.2 1.0 0.0 0.0
    [ 2] 4.7 3.2 1.3 0.2 1.0 0.0 0.0
    [ 3] 4.6 3.1 1.5 0.2 1.0 0.0 0.0
    . . .
    [119] 6.9 3.1 5.4 2.1 0.0 0.0 1.0

    Setting maxEpochs = 50
    Setting learning rate = 0.050

    Starting training
    epoch = 10 ms error = 0.2500
    epoch = 20 ms error = 0.0990
    epoch = 30 ms error = 0.1005
    epoch = 40 ms error = 0.0595
    epoch = 50 ms error = 0.0709

    Training complete

    Accuracy on 120-item train data = 0.9333
    Accuracy on 30-item test data = 0.9667

    End demo

    Conclusion


    Implementing a neural network in Python gives you a complete understanding of what goes on behind the scenes when you use a sophisticated machine learning library like CNTK or TensorFlow, the ability to implement a neural network from scratch gives you the ability to experiment with custom algorithms. The version of back-propagation presented in this article is basic example to help students get started with Python and NumPy.

    Resources

    Azure Notebook Service http://azure.notebooks.com

    Tensorflow https://www.tensorflow.org/

    TensorFlow with Docker https://blogs.msdn.microsoft.com/uk_faculty_connection/2016/09/26/tensorflow-on-docker-with-microsoft-azure/

    CNTK https://www.microsoft.com/en-us/cognitive-toolkit/

    The open-source toolkit can be found on GitHub. Hundreds of new features, performance improvements and fixes have been added since beta was introduced. The performance of Cognitive toolkit was recently independently measured, and on a single GPU it performed best amongst other similar platforms.

    Source: http://dlbench.comp.hkbu.edu.hk/

    Data Science Virtual Machine

    Getting Started with the Data Science VM.

    Windows Edition

    Linux Edition

    Webinar


    Walkthrough of Azure Cosmos DB Graph (Gremlin)

    $
    0
    0

    I show you the general tasks of Azure Cosmos DB Gremlin (graph) for your first use, and a little bit dive into the practical usage of graph query.

    This post will also help the beginner to learn how to use the graph database itself, since Azure Cosmos DB is one of the compliant database to the popular graph framework “Apache TinkerPop“.

    Create your database and collection

    First you must prepare your database.

    With Azure Cosmos DB, you must provision account, database, and collection just like Azure Cosmos DB NoSQL database.
    You can create these objects using API (REST or SDK), but here we use UI of Azure Portal.

    When you create Azure Cosmos DB account in Azure Portal, you must select “Gremlin (graph)” as the supported API as the following picture.

    After you’ve created your account, next you create your database and collection with Data Explorer as follows.
    The following “Database id” is the identifier for a database, and “Graph id” is for a collection.

    Calling API

    Before calling APIs, please copy your account key in your Azure Portal.

    Moreover please copy the Gremlin URI in your Azure Portal.

    Now you can develop your application with APIs.

    As I mentioned before, Azure Cosmos DB is one of the database that is compliant with TinkerPop open source framework. Therefore you can use a lot of existing tools compliant with TinkerPop. (See “Apache TinkerPop” for language drivers and other tools.)
    For example, if you use PHP for your programming, you can easily download and install gremlin-php by the following command. (You can also use App Service Editor in Azure App Services. No need to prepare your local physical machine for trial !)

    curl http://getcomposer.org/installer | php
    php composer.phar require brightzone/gremlin-php "2.*"

    The following is the simple PHP program code which is retrieving all vertices (nodes) in graph database. (Later I explain about the gremlin language.)

    Note that :

    • host is the host name of the previously copied gremlin uri.
    • username is /dbs/{your database name}/colls/{your collection name}.
    • password is the previously copied account key.
    <?php
    require_once('vendor/autoload.php');
    use BrightzoneGremlinDriverConnection;
    
    $db = new Connection([
      'host' => 'graph01.graphs.azure.com',
      'port' => '443',
      'graph' => 'graph',
      'username' => '/dbs/db01/colls/test01',
      'password' => 'In12qhzXYz...',
      'ssl' => TRUE
    ]);
    $db->open();
    $res = $db->send('g.V()');
    $db->close();
    
    // output the all vertex in db
    var_dump($res);
    ?>

    The retrieved result is so called GraphSON format as follows. In this PHP example, the result will be serialized to the PHP array with the following same format.

    {
      "id": "u001",
      "label": "person",
      "type": "vertex",
      "properties": {
        "firstName": [
          {
            "value": "John"
          }
        ],
        "age": [
          {
            "value": 45
          }
        ]
      }
    }

    You can also use SDK for Azure Cosmos DB graph (.NET, Java, Node.js), which is specific for Azure Cosmos DB.
    Especially, if you need some specific operations for Azure Cosmos DB (ex: creating or managing database, collections, etc), it’s better to use this SDK.

    For example, the following is the C# example code using Azure Cosmos DB Graph SDK. (Here the gremlin language is also used. Later I explain about the details.)
    Note that the endpoint differs from the previous gremlin uri.

    using Microsoft.Azure.Documents;
    using Microsoft.Azure.Documents.Client;
    using Microsoft.Azure.Documents.Linq;
    using Microsoft.Azure.Graphs;
    using Newtonsoft.Json;
    
    static void Main(string[] args)
    {
      using (DocumentClient client = new DocumentClient(
        new Uri("https://graph01.documents.azure.com:443/"),
        "In12qhzXYz..."))
      {
        DocumentCollection graph = client.CreateDocumentCollectionIfNotExistsAsync(
          UriFactory.CreateDatabaseUri("db01"),
          new DocumentCollection { Id = "test01" },
          new RequestOptions { OfferThroughput = 1000 }).Result;
        // drop all vertex
        IDocumentQuery<dynamic> query1 =
          client.CreateGremlinQuery<dynamic>(graph, "g.V().drop()");
        dynamic result1 = query1.ExecuteNextAsync().Result;
        Console.WriteLine($"{JsonConvert.SerializeObject(result1)}");
        // add vertex
        IDocumentQuery<dynamic> query2 =
          client.CreateGremlinQuery<dynamic>(graph, "g.addV('person').property('id', 'u001').property('firstName', 'John')");
        dynamic result2 = query2.ExecuteNextAsync().Result;
        Console.WriteLine($"{JsonConvert.SerializeObject(result2)}");
      }
    
      Console.WriteLine("Done !");
      Console.ReadLine();
    }

    Before building your application with Azure Cosmos DB SDK, you must install Microsoft.Azure.Graphs package with NuGet. (Other dependent libraries like Microsoft.Azure.DocumentDB, etc are also installed in your project.)

    Interactive Console and Visualize

    As I described above, TinkerPop framework is having the various open source utilities contributed by communities.

    For example, if you want to run the gremlin language (query, etc) with the interactive console, you can use Gremlin Console.
    Please see the official document “Azure Cosmos DB: Create, query, and traverse a graph in the Gremlin console” for details about Gremlin Console with Azure Cosmos DB.

    There’re also several libraries or software for visualizing gremlin-compatibile graph in Tinkerpop framework.

    If you’re using Visual Studio and Azure Cosmos DB, the following Github sample source (written as ASP.NET web project) is very easy to use for visualizing Azure CosmosDB graph.

    [Gitub] Azure-Samples / azure-cosmos-db-dotnet-graphexplorer
    https://github.com/Azure-Samples/azure-cosmos-db-dotnet-graphexplorer

    http://i1155.photobucket.com/albums/p551/tsmatsuz/20170630_Graph_Visualize_zpszcfudx7r.jpg

    Gremlin Language

    As you’ve seen in my previous programming example, it’s very important to understand the gremlin language (query, etc) for your practical use.
    Let’s dive into the gremlin language (query, etc), which is not deep, but practical level of understanding.

    First, we simply create the vertex (node).
    The following is creating 2 vertices of “John” and “Mary”.

    g.addV('employee').property('id', 'u001').property('firstName', 'John').property('age', 44)
    g.addV('employee').property('id', 'u002').property('firstName', 'Mary').property('age', 37)

    The following is creating the edge between 2 vertices of John and Mary. (This sample means that John is a manager for Mary.)
    As you can see, you can specify (identify) the targeting vertex with the previous “id” property.

    g.V('u002').addE('manager').to(g.V('u001'))

    In this post, we use the following simple structure (vertices and edges) for our subsequent examples.

    g.addV('employee').property('id', 'u001').property('firstName', 'John').property('age', 44)
    g.addV('employee').property('id', 'u002').property('firstName', 'Mary').property('age', 37)
    g.addV('employee').property('id', 'u003').property('firstName', 'Christie').property('age', 30)
    g.addV('employee').property('id', 'u004').property('firstName', 'Bob').property('age', 35)
    g.addV('employee').property('id', 'u005').property('firstName', 'Susan').property('age', 31)
    g.addV('employee').property('id', 'u006').property('firstName', 'Emily').property('age', 29)
    g.V('u002').addE('manager').to(g.V('u001'))
    g.V('u005').addE('manager').to(g.V('u001'))
    g.V('u004').addE('manager').to(g.V('u002'))
    g.V('u005').addE('friend').to(g.V('u006'))
    g.V('u005').addE('friend').to(g.V('u003'))
    g.V('u006').addE('friend').to(g.V('u003'))
    g.V('u006').addE('manager').to(g.V('u004'))

    The following is the example which retrieves vertices with some query conditions. This retrieves the employees whose age is greater than 40. (If you query edges, use g.E() instead of g.V().)

    g.V().hasLabel('employee').has('age', gt(40))

    As I described above, the retrieved result is so called GraphSON format as follows.

    {
      "id": "u001",
      "label": "employee",
      "type": "vertex",
      "properties": {
        "firstName": [
          {
            "id": "9a5c0e2a-1249-4e2c-ada2-c9a7f33e26d5",
            "value": "John"
          }
        ],
        "age": [
          {
            "id": "67d681b1-9a24-4090-bac5-be77337ec903",
            "value": 44
          }
        ]
      }
    }

    You can also use the logical operation (and(), or()) for the graph query.
    For example, the following returns only “Mary”.

    g.V().hasLabel('employee').and(has('age', gt(35)), has('age', lt(40)))

    Next we handle the traversals. (You can traverse the edge.)
    Next is the simple traversal example, which just retrieves Mary’s manager. (The result will be “John”.)

    g.V('u002').out('manager').hasLabel('employee')

    Note that the following returns the same result. The operation outE() returns the edge element and is getting the incoming vertex by inV(). (Explicitly traversing elements, vertex -> edge -> vertex.)

    g.V('u002').outE('manager').inV().hasLabel('employee')

    The following retrieves Mary’s manager (i.e, “John”) and retrieves the all employees whose direct report is him (“John”).
    The result will be “Mary” and “Susan”.

    g.V('u002').out('manager').hasLabel('employee').in('manager').hasLabel('employee')

    If you want to omit the repeated elements in path, you can use simplePath() as follows. This returns only “Susan”, because “Mary” is the repeated vertex.

    g.V('u002').out('manager').hasLabel('employee').in('manager').hasLabel('employee').simplePath()

    Now let’s consider the traversal of the relation “friend”. (See the picture illustrated above.)
    As you know, “manager” is the directional relation, but “friend” will be the undirectional (non-directional) relation. That is, if A is a friend of B, B will also be a friend of A.
    In such a case, you can use both() (or bothE()) operation as follows. The following retrieves Emily’s friend, and the result is both “Susan” and “Christie”.

    g.V('u006').both('friend').hasLabel('employee')

    If you want to traverse until some condition matches, you can use repeat().until().
    The following retrieves the reporting path (the relation of direct reports) from “John” to “Emily”.

    g.V('u001').repeat(in('manager')).until(has('id', 'u006')).path()

    The result is “John” – “Mary” – “Bob” – “Emily” as the following GraphSON.

    {
      "labels": [
        ...
      ],
      "objects": [
        {
          "id": "u001",
          "label": "employee",
          "type": "vertex",
          "properties": {
            "firstName": [
              {
                "id": "9a5c0e2a-1249-4e2c-ada2-c9a7f33e26d5",
                "value": "John"
              }
            ],
            "age": [
              {
                "id": "67d681b1-9a24-4090-bac5-be77337ec903",
                "value": 44
              }
            ]
          }
        },
        {
          "id": "u002",
          "label": "employee",
          "type": "vertex",
          "properties": {
            "firstName": [
              {
                "id": "8d3b7a38-5b8e-4614-b2c4-a28306d3a534",
                "value": "Mary"
              }
            ],
            "age": [
              {
                "id": "2b0804e5-58cc-4061-a03d-5a296e7405d9",
                "value": 37
              }
            ]
          }
        },
        {
          "id": "u004",
          "label": "employee",
          "type": "vertex",
          "properties": {
            "firstName": [
              {
                "id": "3b804f2e-0428-402c-aad1-795f692f740b",
                "value": "Bob"
              }
            ],
            "age": [
              {
                "id": "040a1234-8646-4412-9488-47a5af75a7d7",
                "value": 35
              }
            ]
          }
        },
        {
          "id": "u006",
          "label": "employee",
          "type": "vertex",
          "properties": {
            "firstName": [
              {
                "id": "dfb2b624-e145-4a78-b357-5e147c1de7f6",
                "value": "Emily"
              }
            ],
            "age": [
              {
                "id": "f756c2e9-a16d-4959-b9a3-633cf08bcfd7",
                "value": 29
              }
            ]
          }
        }
      ]
    }

    Finally, let’s consider the shortest path from “Emily” to “John”. We assume that you can traverse either “manager” (directional) or “friend” (undirectional).

    Now the following returns the possible paths from “Emily” to “John” connected by either “manager” (directional) or “friend” (undirectional).

    g.V('u006').repeat(union(both('friend').simplePath(), out('manager').simplePath())).until(has('id', 'u001')).path()

    This result is 3 paths :
    Emily – Susan – John
    Emily – Christie – Susan – John
    Emily – Bob – Mary – John

    When you want to count the number of each paths (current local elements), use count(local) operation.

    g.V('u006').repeat(union(both('friend').simplePath(), out('manager').simplePath())).until(has('id', 'u001')).path().count(local)

    This result is :
    3
    4
    4

    Then the following returns both count and paths as follows.

    g.V('u006').repeat(union(both('friend').simplePath(), out('manager').simplePath())).until(has('id', 'u001')).path().group().by(count(local))
    {
      "3": [
        {
          "labels": [...],
          "objects": [
            {
              "id": "u006",
              ...
            },
            {
              "id": "u005",
              ...
            },
            {
              "id": "u001",
              ...
            }
          ]
        }
      ],
      "4": [
        {
          "labels": [...],
          "objects": [
            {
              "id": "u006",
              ...
            },
            {
              "id": "u003",
              ...
            },
            {
              "id": "u005",
              ...
            },
            {
              "id": "u001",
              ...
            }
          ]
        },
        {
          "labels": [...],
          "objects": [
            {
              "id": "u006",
              ...
            },
            {
              "id": "u004",
              ...
            },
            {
              "id": "u002",
              ...
            },
            {
              "id": "u001",
              ...
            }
          ]
        }
      ]
    }


    [Reference]

    TinkerPop Documentation (including language reference)
    http://tinkerpop.apache.org/docs/current/reference/


    Create Bot for Microsoft Graph with DevOps 9: BotBuilder features – FormFlow 101

    $
    0
    0

    DialogPrompt is great, but if you want to simply create a form, then FormFlow is the one you want to use.

    Create a form by using FormFlow

    FormFlow uses model to create a form.

    Add model

    1. Open O365Bot solution and add Models folder.

    image

    2. Add OutlookEvent.cs and replace the code. Don’t forget to add Serializable attribute.

    using System;
    
    namespace O365Bot.Models
    {
        [Serializable]
        public class OutlookEvent
        {
            public string Subject { get; set; }
            public string Description { get; set; }
            public DateTime Start { get; set; }
            public bool IsAllDay { get; set; }
            public double Hours { get; set; }
        }
    }

    Update CreateDialog.cs

    Now use the model you just added to generate a form. Replace the code with following. As you can see, you need less lines.

    using Autofac;
    using Microsoft.Bot.Builder.Dialogs;
    using Microsoft.Bot.Builder.FormFlow;
    using Microsoft.Graph;
    using O365Bot.Models;
    using O365Bot.Services;
    using System;
    using System.Threading.Tasks;
    
    namespace O365Bot.Dialogs
    {
        [Serializable]
        public class CreateEventDialog : IDialog<bool>
        {
            public async Task StartAsync(IDialogContext context)
            {
                // Create a from
                var outlookEventFormDialog = FormDialog.FromForm(this.BuildOutlookEventForm, FormOptions.PromptInStart);
                context.Call(outlookEventFormDialog, this.ResumeAfterDialog);
            }
    
            private async Task ResumeAfterDialog(IDialogContext context, IAwaitable<OutlookEvent> result)
            {
                await context.PostAsync("The event is created.");
    
                // Complete the child dialog.
                context.Done(true);
            }
    
            private IForm<OutlookEvent> BuildOutlookEventForm()
            {
                OnCompletionAsyncDelegate<OutlookEvent> processOutlookEventCreate = async (context, state) =>
                {
                    using (var scope = WebApiApplication.Container.BeginLifetimeScope())
                    {
                        IEventService service = scope.Resolve<IEventService>(new TypedParameter(typeof(IDialogContext), context));
                        Event @event = new Event()
                        {
                            Subject = state.Subject,
                            Start = new DateTimeTimeZone() { DateTime = state.Start.ToString(), TimeZone = "Tokyo Standard Time" },
                            IsAllDay = state.IsAllDay,
                            End = state.IsAllDay ? null : new DateTimeTimeZone() { DateTime = state.Start.AddHours(state.Hours).ToString(), TimeZone = "Tokyo Standard Time" },
                            Body = new ItemBody() { Content = state.Description, ContentType = BodyType.Text }
                        };
                        await service.CreateEvent(@event);
                    }
                };
    
                return new FormBuilder<OutlookEvent>()
                    .Message("Creating an event.")
                    .AddRemainingFields() // add all (remaing) fields to the form.
                    .OnCompletion(processOutlookEventCreate)
                    .Build();
            }
        }
    }

    Try with emulator

    Run the application and connect to the server via emulator.

    image

    Everything seems okay, but let’s modify the display string.

    FormFlow attributes for Model

    There are several places where you can change the display string. This time, specify Prompt attribute to model. Replace the code in OutlookEvent.cs, You can use pattern language such as {||} to let user select from options as part of Prompt. See here for more detail.

    using Microsoft.Bot.Builder.FormFlow;
    using System;
    
    namespace O365Bot.Models
    {
        [Serializable]
        public class OutlookEvent
        {
            [Prompt("What is the title?")]
            public string Subject { get; set; }
            [Prompt("What is the detail?")]
            public string Description { get; set; }
            [Prompt("When do you start? Use dd/MM/yyyy HH:mm format.")]
            public DateTime Start { get; set; }
            [Prompt("Is this all day event?{||}")]
            public bool IsAllDay { get; set; }
            [Prompt("How many hours?", "Please answer by number")]
            public double Hours { get; set; }
        }
    }

    Try with emulator

    Run the application and connect to the server via emulator.

    image

    Now it looks work exactly same as last article. However, several test shall fail.

    image

    Summery

    FormFlow is so easy to create a form, but you can do more. Next time, I will explain more detailed features and make all test pass.

    GitHub: https://github.com/kenakamu/BotWithDevOps-Blog-sample/tree/master/article9

    Ken

    Junte-se a nós! Encontro #4 SQL Server RS + Encontro #1 .NET Caxias

    $
    0
    0

    No dia 15 de Julho teremos na cidade de Caxias do Sul o evento do Sql Server RS junto com o primeiro encontro do grupo .Net Caxias não perca a oportunidade de aprender sobre .NET com o Lenerson Velho Nunes que abordará o tema “Teste de Software”  outro tema que será explorado é SQL Server com o Arthur Luz que falará sobre “Descubra o Poder da Aná¡lise de dados com Power BI”.


    Inscreva-se agora!

    Nos vemos lá!


    Dynamics 365 – WebAPI CRUD Operations (C#)

    $
    0
    0

    I’ve added this post to showcase the CRUD operations in C# through WebAPI endpoint. You must have working experience in below areas: –

    • Program using C#
    • Dynamics 356 Online.
    • Visual Studio
    • Conceptual knowledge of ODATA Operations.
    • Using ADAL + OAuth

    All the operations below require access token to be passed as a header hence it’s important to know how to use ADAL (Active Directory Azure Authentication Library).

    WebAPI (or REST) endpoints are very easy to program as they just require you to know the authentication protocol then it’s all about sent HTTP Requests with respective OData Filters. Each operation requires a unique set of URLs to be passed. Below you see a sample for creating a record. You can find completed repository on GitHub.

            /// <summary>
            /// This function can create any record type using Json Entity Objects
            /// </summary>
            /// <param name="entityName"></param>
            /// <param name="entityObject"></param>
            /// <returns></returns>
            public async Task CreateEntityRecords(string entityName, JObject entityObject)
            {
                using (httpClient = CreateDynHttpClient(AccessToken, entityName))
                {
                    HttpRequestMessage createHttpRequest = new HttpRequestMessage(HttpMethod.Post, BaseOrganizationApiUrl + "/api/data/v8.1/" + entityName);
                    createHttpRequest.Content = new StringContent(entityObject.ToString(), Encoding.UTF8, "application/json");
                    var response = await httpClient.SendAsync(createHttpRequest);
                    response.EnsureSuccessStatusCode();
                    if (response.StatusCode == HttpStatusCode.NoContent)
                    {
                        // Do something with response. Example get content:
                        Console.WriteLine("The record was created successfully.");
                        Console.ReadKey();
                    }
                }
            }


    Happy WebAPI’ing 🙂

    Cheers,

    Small Basic – Textbox UX (Part 2)

    $
    0
    0

    Question: How to show entered words in textbox on any other coordinate “after pressing enter key” was asked by msdn.yogesh last October in Small Basic forum.  And yesterday he asked again: how can i do this with “keyboard enter key”.

    This question reminds me an idea for using textbox.  The idea is using both a textbox and the key event.  The program sample is MDP504-3.  This program has only a textbox in the window.  Push [Enter] key after input a text.

    Screen shot of a program TextBox Sample 0.4

    Another variation is MDP504-4 – both [Enter] key and [OK] button are available.

    Screen shot of a program TextBox Sample 0.5

    Thank you msdn.yogesh for your question.

    See Also

    Viewing all 5308 articles
    Browse latest View live


    <script src="https://jsc.adskeeper.com/r/s/rssing.com.1596347.js" async> </script>